

View Favorites
GL Forecasting Dashboard – Balance Sheet
Balance Sheet Simulation Dashboards to Streamline the Modelling and Forecasting Process
How can Simulation Dashboards Drive Faster and Better Decisions?
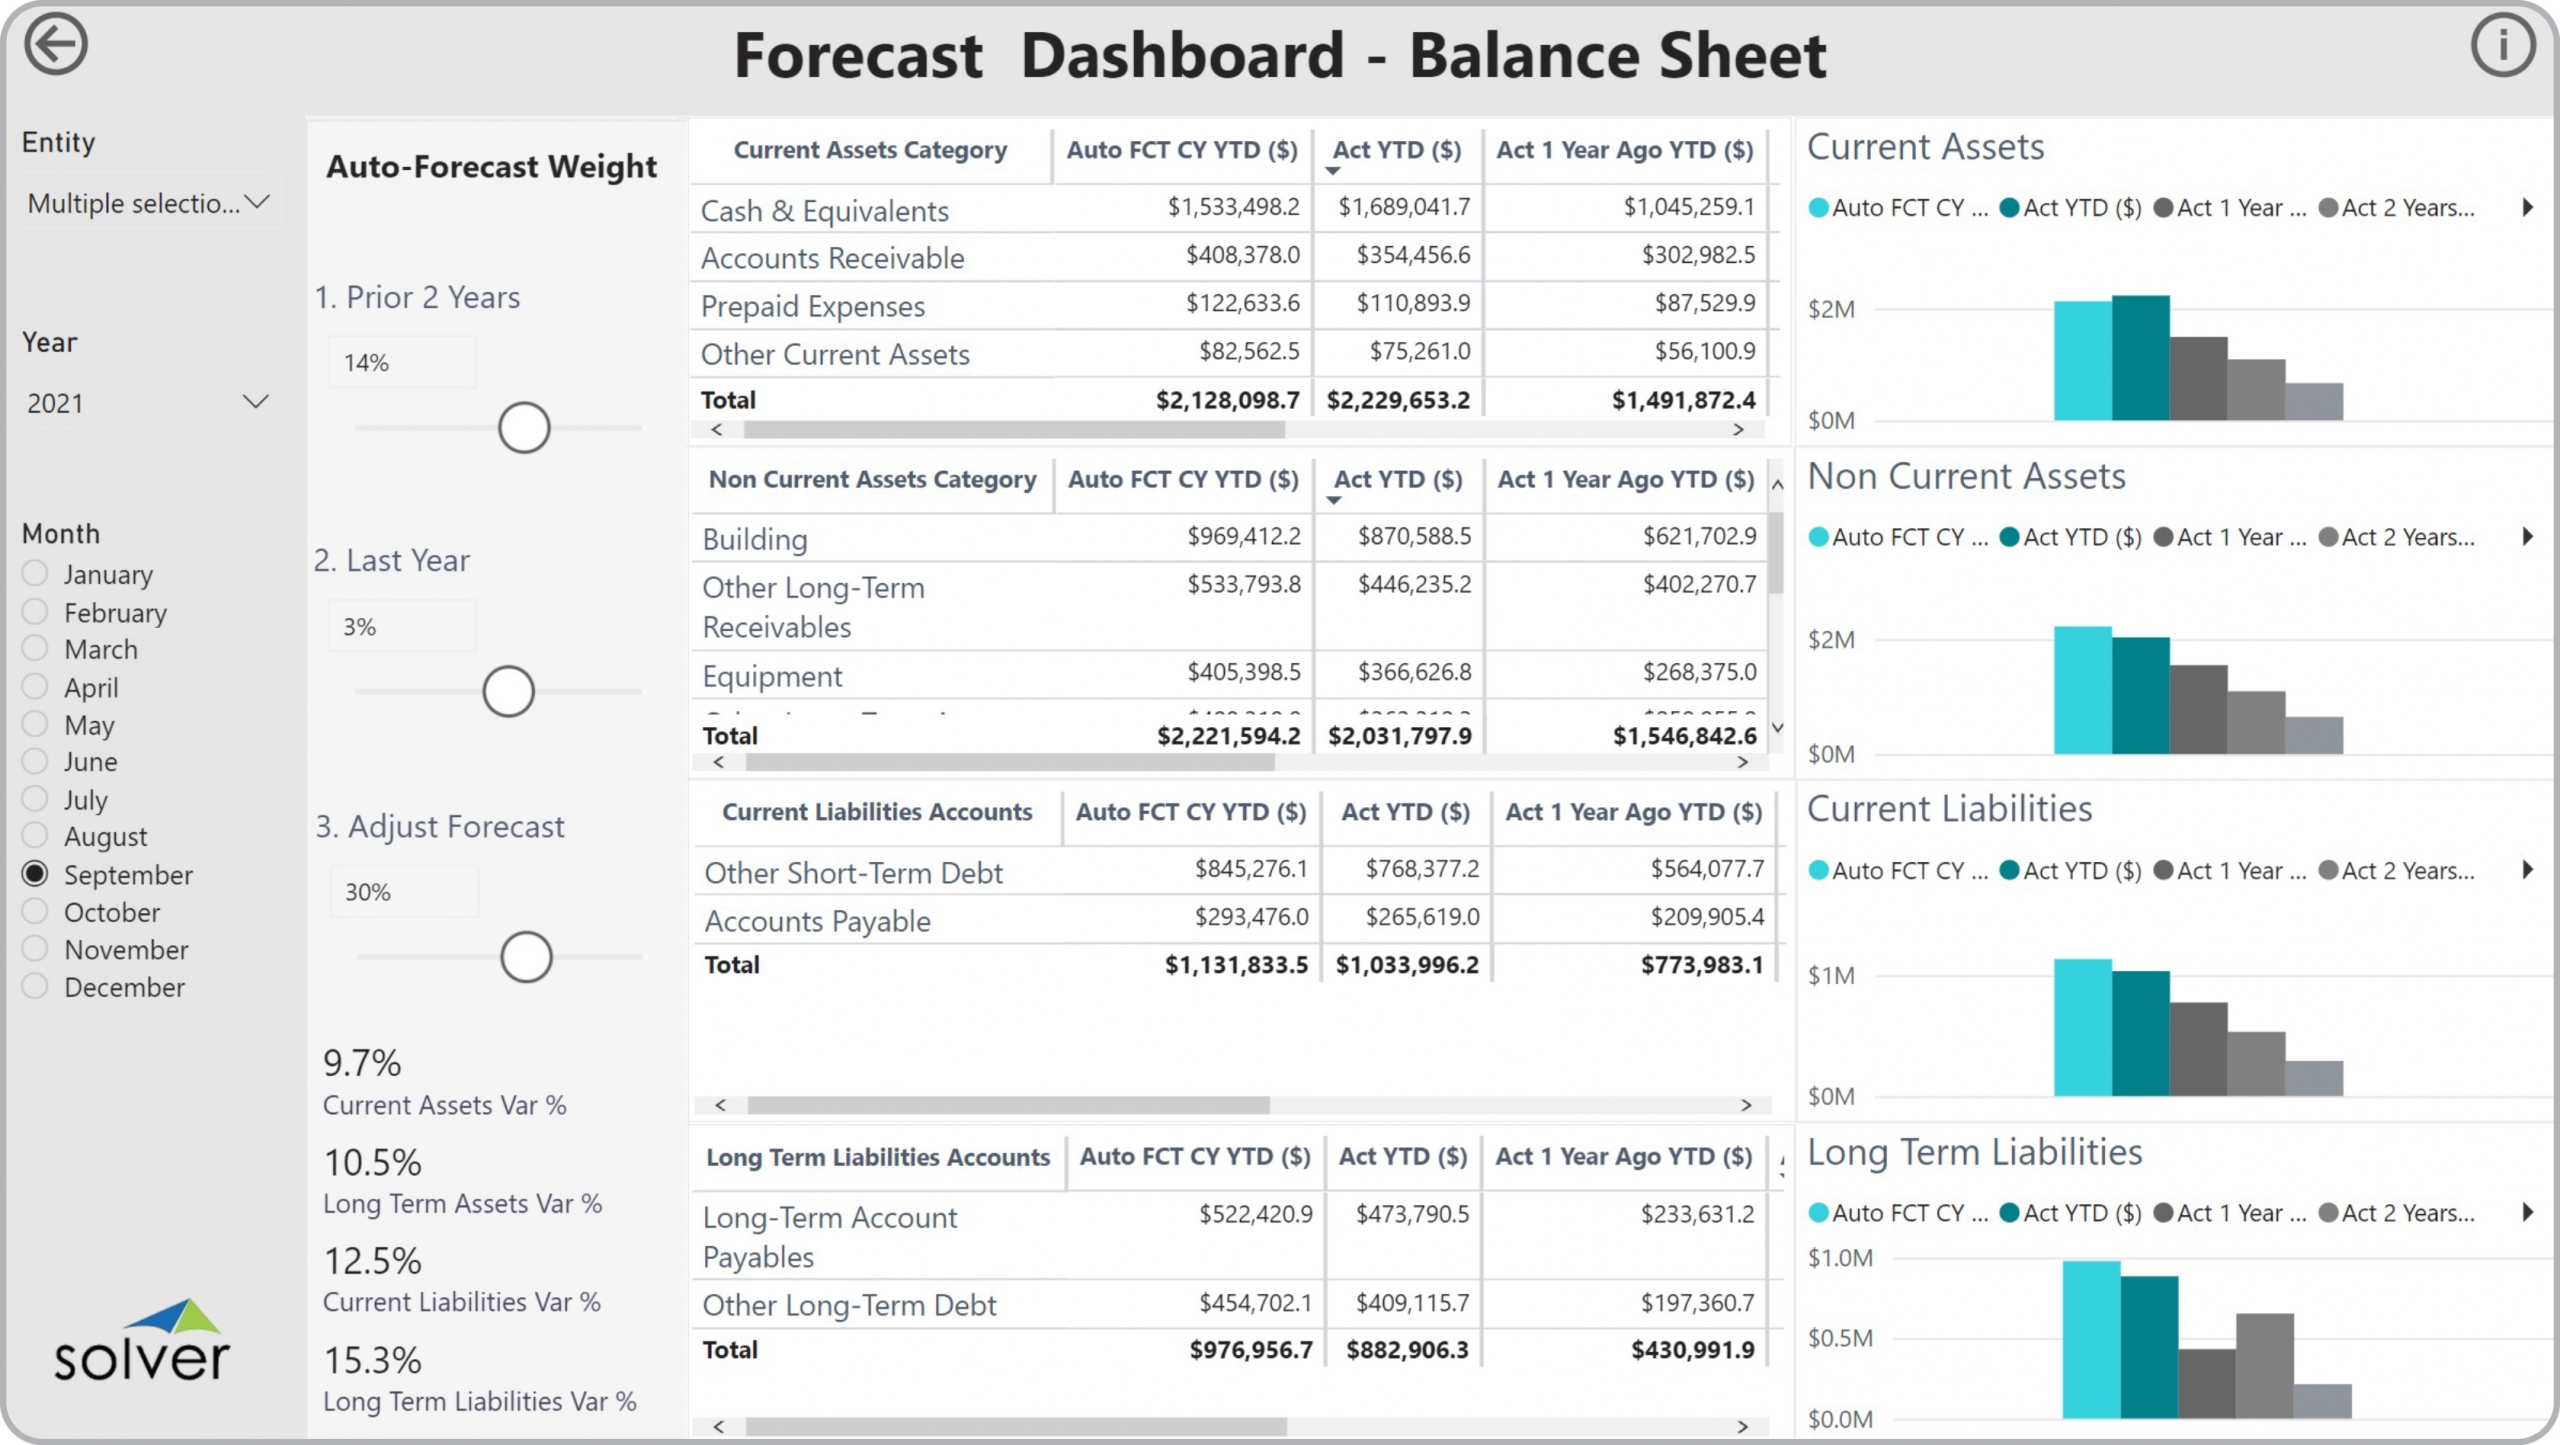
As FP&A Managers increasingly become central figures in the Modelling and Forecasting Process, they must rely on modern self-service corporate performance management (CPM) and business intelligence (BI) tools. Using interactive Simulation Dashboards like the Balance Sheet Simulation Dashboard template shown below enables them and users from the Accounting and Finance teams to experience near real time simulation that help drive faster and better decisions.
Who uses Balance Sheet Simulation Dashboards and What are Some Key Analytical Features?
In today’s fast-paced business environment, FP&A Managers are under high pressure to supply end users like CFOs and analysts with timely and concise Simulation Dashboards. Companies use key features like the ones below to support their users with effective analysis that helps drive risk control and resource maximization.
- Sliders to increase or decrease the weighting of historical data in the current year estimate
- Comparison of simulation result with three years of history
- Focus on Assets and Liabilities
View Favorites