

View Favorites
GL Dashboard – Profitability Benchmarking
Profitability Benchmarking Dashboards to Streamline the Monthly Reporting Process
How can Financial Dashboards Drive Faster and Better Decisions?
As CFOs increasingly become key advisors in the Monthly Reporting Process, they must rely on modern self-service corporate performance management (CPM) and business intelligence (BI) tools. Using interactive Financial Dashboards like the Profitability Benchmarking Dashboard template shown below enables them and users from the board and executive teams to experience near real time profitability metrics that help drive faster and better decisions.
Who uses Profitability Benchmarking Dashboards and What are Some Key Analytical Features?
In today’s fast-paced business environment, CFOs are under high pressure to supply end users like board members and leaders with timely and concise Financial Dashboards. Companies use key features like the ones below to support their users with effective analysis that helps drive optimal performance for subsidiaries:
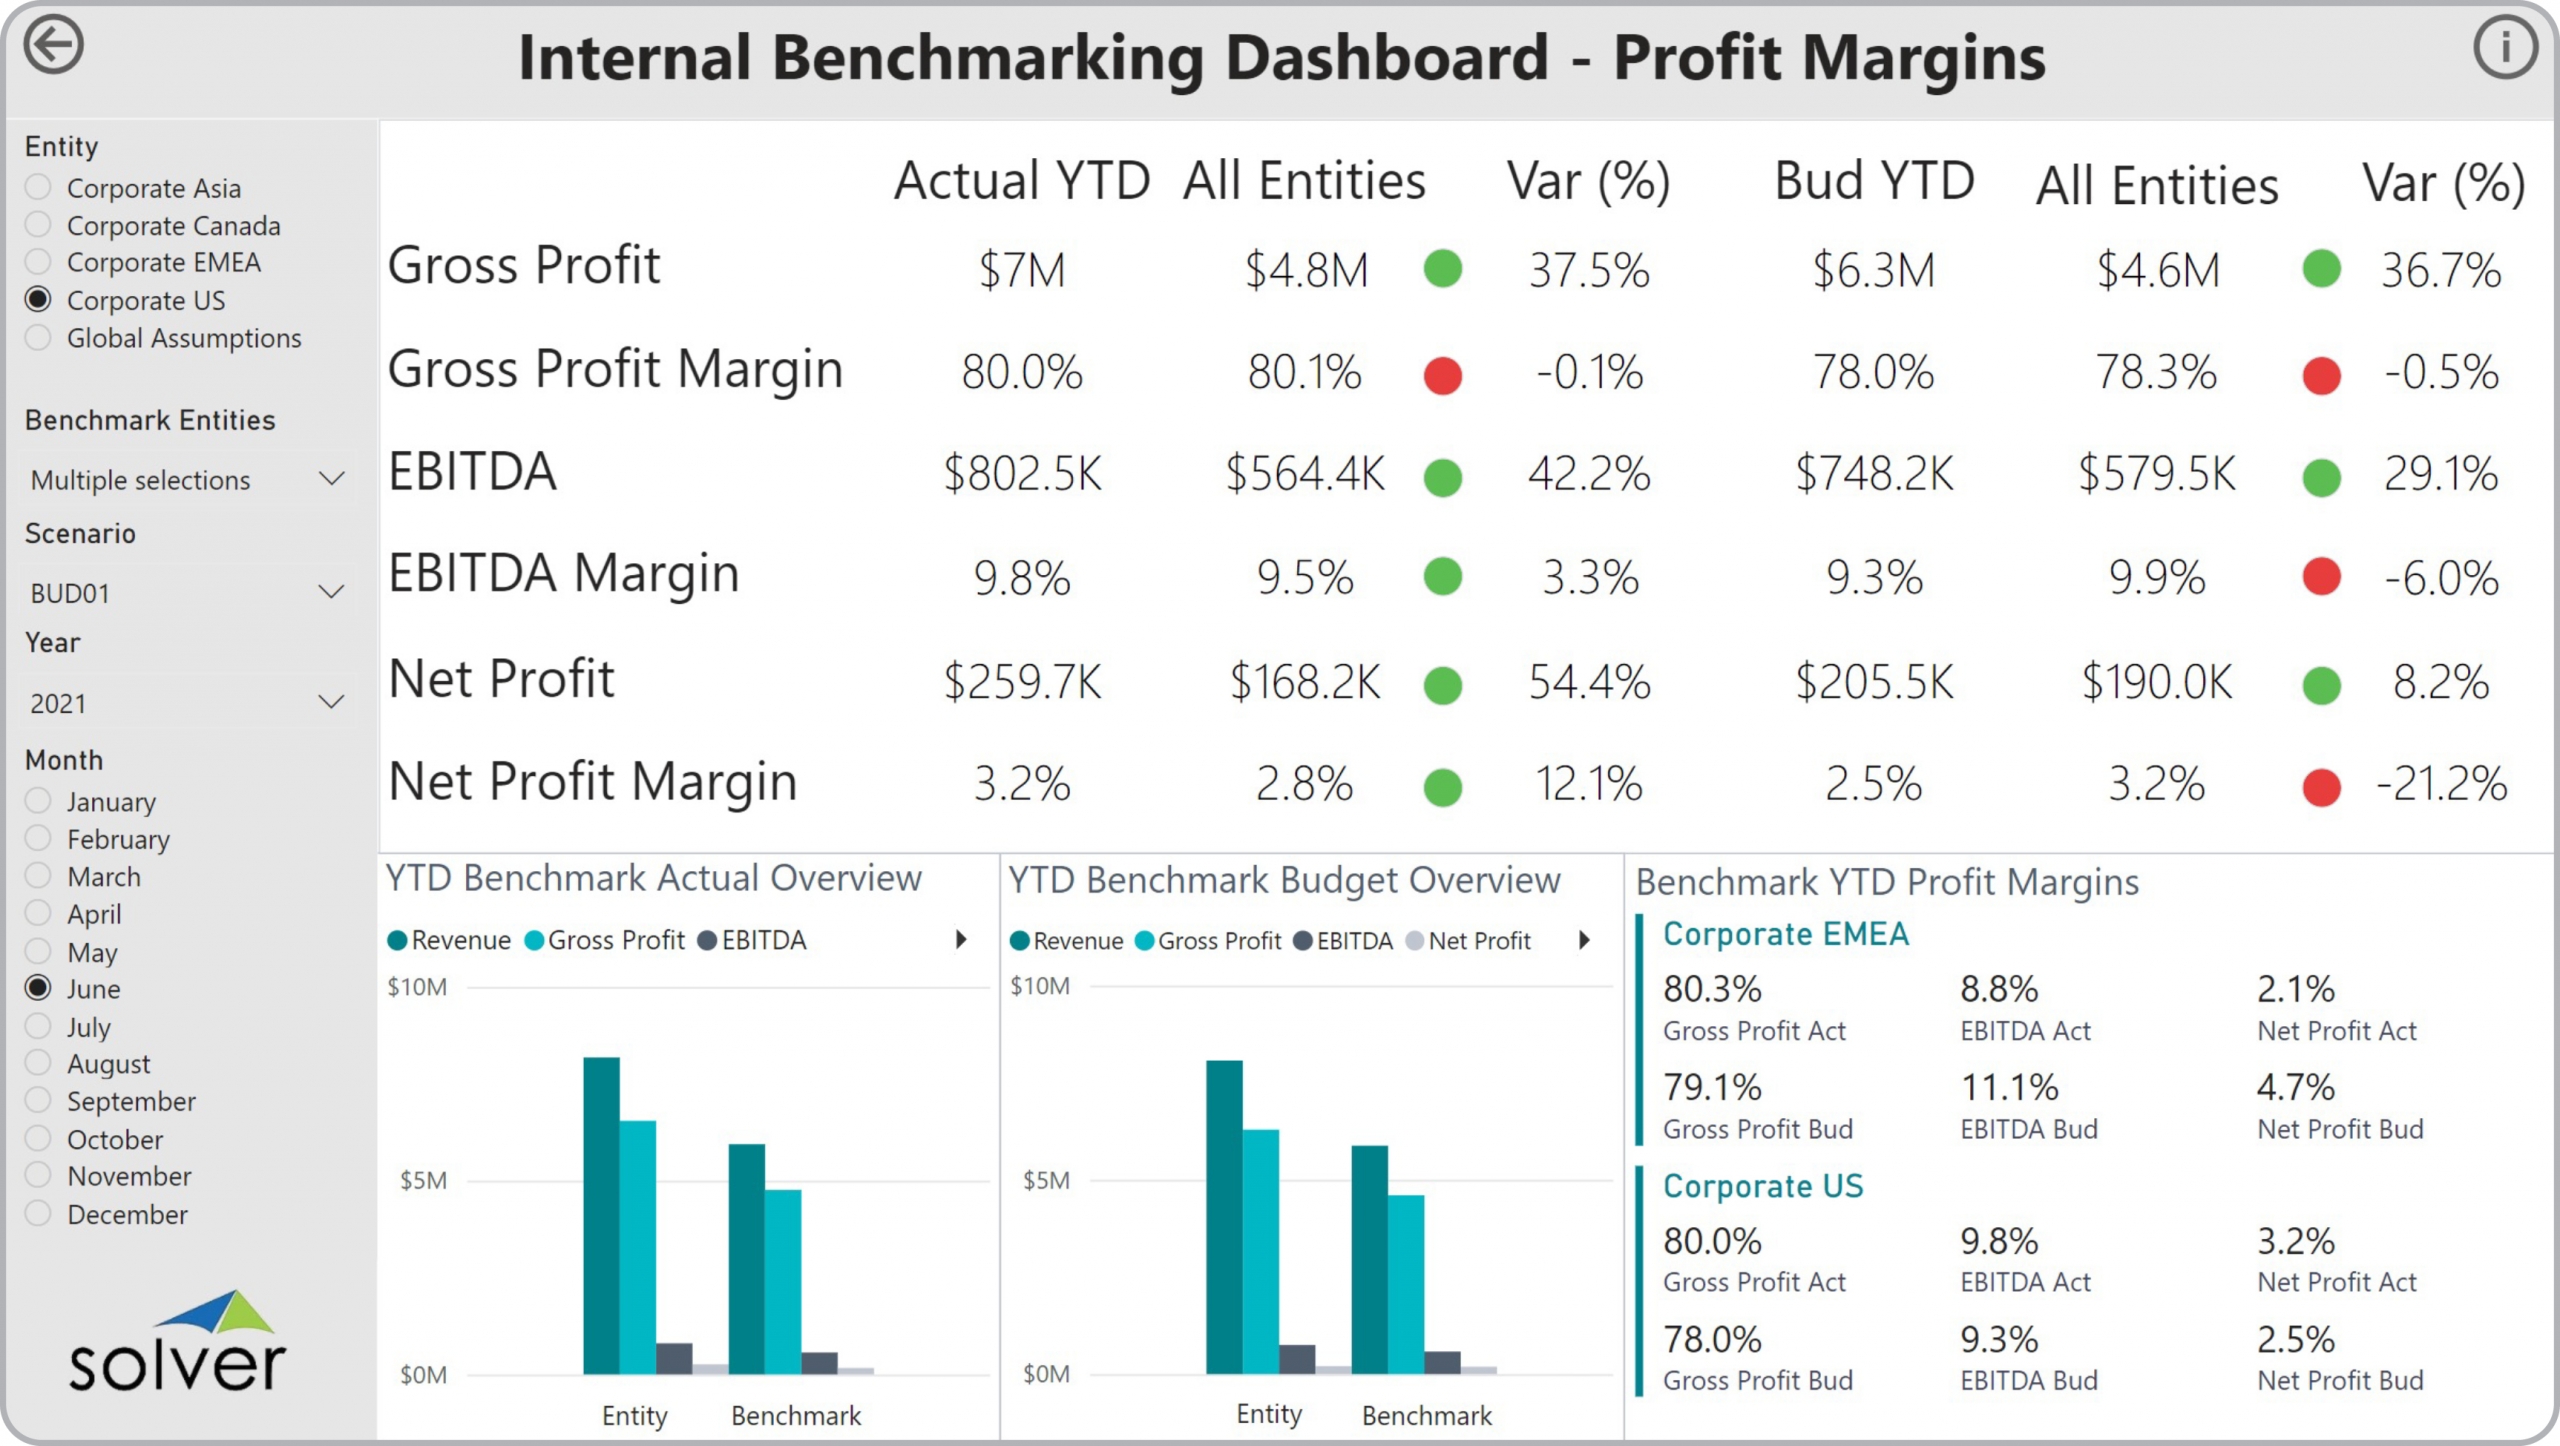
- Year-to-date (YTD) profit metric tables with the chosen business unit benchmarked against the average of all business units
- Charts comparing Year-to-Date (YTD) Actual and Budgets for the chosen business unit with the average of all units
- Period, company and other filters that dynamically drive the dashboard
View Favorites