

View Favorites
GL Dashboard – Business Comparison – Balance Sheet
Balance Sheet Comparison Dashboards to Streamline the Monthly Reporting Process
How can Financial Dashboards Drive Faster and Better Decisions?
As CFOs increasingly become key advisors in the Monthly Reporting Process, they must rely on modern self-service corporate performance management (CPM) and business intelligence (BI) tools. interactive Financial Dashboards like the Balance Sheet Comparison Dashboard template shown below enables them and users from the finance and executive teams to experience near real time asset and liability comparative and consolidated data that help drive faster and better decisions.
Who uses Balance Sheet Comparison Dashboards and What are Some Key Analytical Features?
In today’s fast-paced business environment, CFOs are under high pressure to supply end users like accountants and analysts with timely and concise Financial Dashboards. Companies use key features like the ones below to support their users with effective analysis that helps drive risk control and investment optimization across subsidiaries:
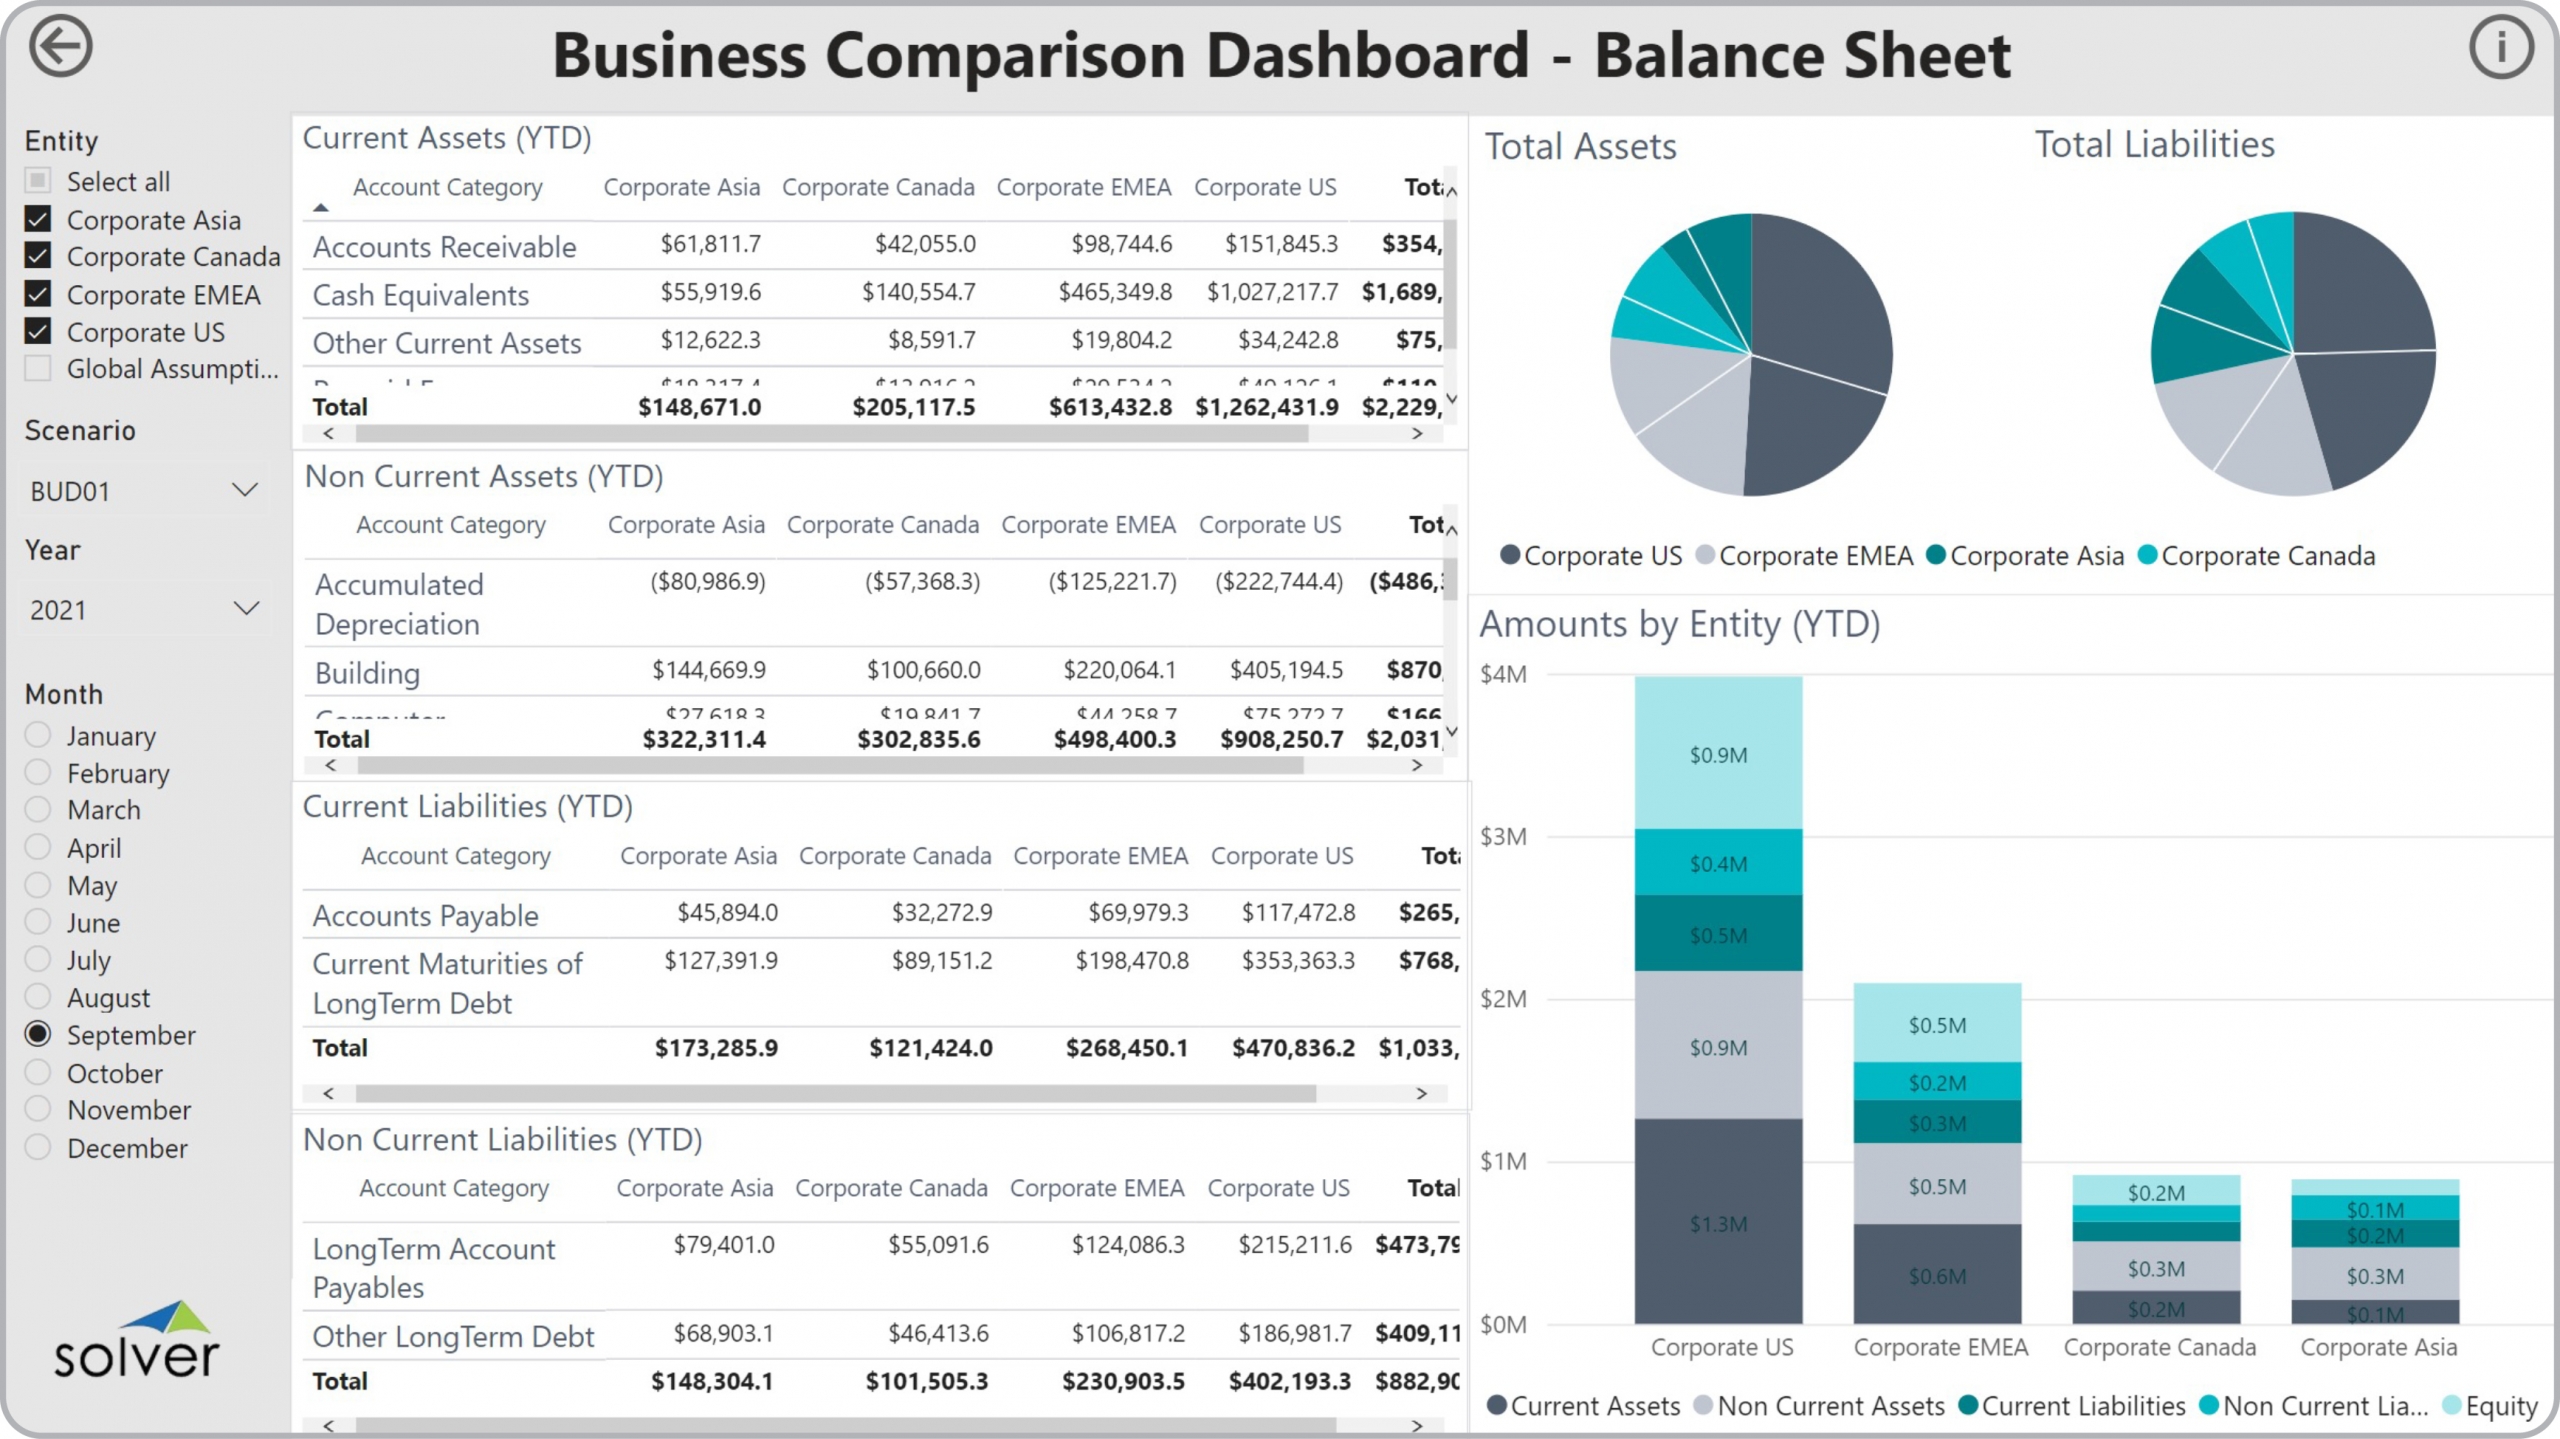
- Comparative tables with Actual year-to-date (YTD) metrics by GL balance sheet account
- Stacked column charts by subsidiary
- Pie charts showing each subsidiary’s share of consolidated Assets and Liabilities
View Favorites