

P&L Variance with Consolidation & SPV Entity
P&L Consolidation Reports with Multi-tabs to Streamline the Monthly Reporting Process
How can Financial Statements Drive Faster and Better Decisions?
As Corporate Controllers increasingly become key advisors in the Monthly Consolidation and Reporting Process, they must rely on modern self-service corporate performance management (CPM) and business intelligence (BI) tools. Using interactive Financial Statements like the P&L Consolidation Report with Breakdown by Company template shown below enables them and users from the parent company management teams to experience near real time consolidated and individual company P&Ls that help drive faster and better decisions.
Who uses P&L Consolidation Reports with Sheet Per Value and What are Some Key Analytical Features?
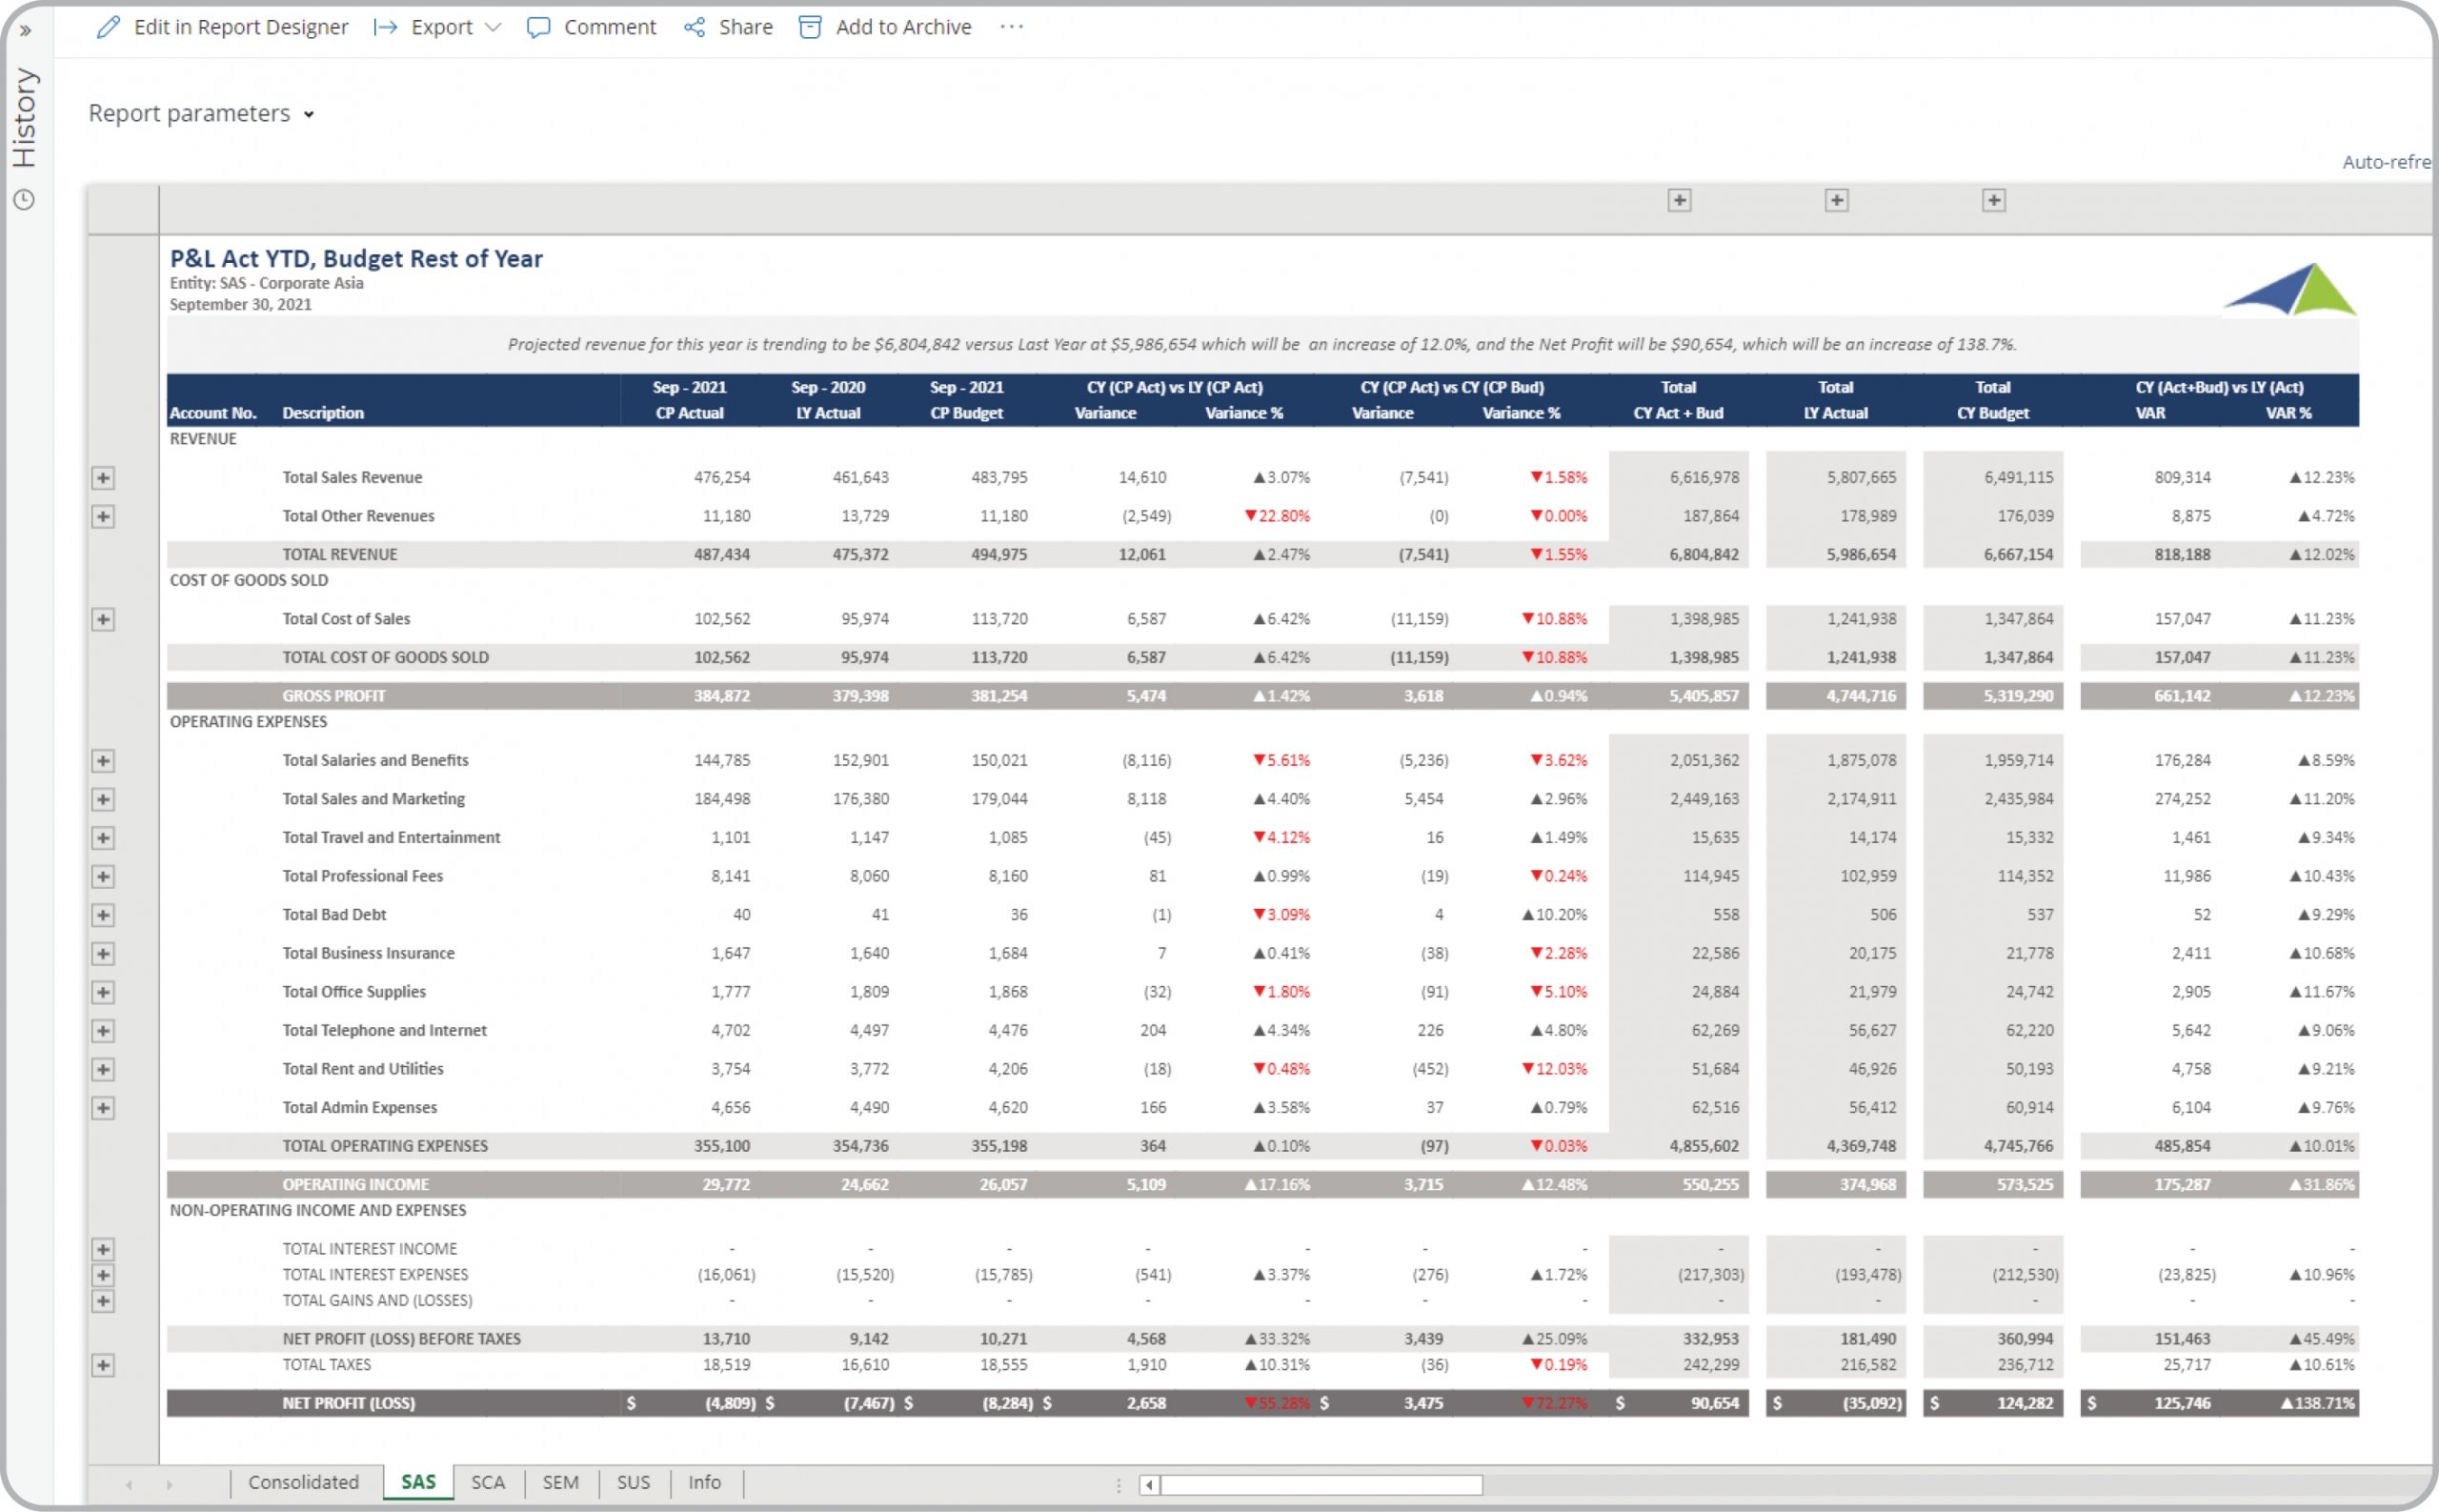
In today’s fast-paced business environment, Corporate Controllers are under high pressure to supply end users like executives and finance managers with timely and concise Financial Statements. Companies use key features like the ones below to support their users with effective analysis that helps drive better and faster corporate headquarter decisions:
- The report shows a consolidated P&L plus each individual entity on a separae tab (sheet per value)
- All subsidiaries selected in the report filter will automatically be displayed on individual tabs in the same report book
- Period, company and other filters dynamically drive the report